Are you looking for a seamless way to present key performance indicators (KPIs) to your management team? Innovation dashboards present complex innovation data in a visually appealing and easily understandable manner. Interactive charts and graphs help users quickly grasp trends, patterns, and correlations, facilitating data-driven decision-making.
In this blog, we'll explore using custom innovation dashboards to configure personalized charts and dashboards that streamline your management reporting processes and drive informed and strategic decision-making.
What is an innovation dashboard
An innovation dashboard provides organizations with a clear and comprehensive overview of some of their innovation initiatives. It is a centralized visualization tool that enhances reporting and decision-making processes.
Distilling information into actionable insights is crucial for a swift and efficient decision-making process. With custom dashboards, you can create dynamic and visually captivating management reports, tailoring at-a-glance views of essential data points to your specific objectives for relevant decision-makers.
Let's explore how an innovation dashboard can enhance your management reporting.
The power of custom innovation dashboards
Gone are the days of static spreadsheets and traditional reports that often drown readers in data. Custom dashboards offer an intuitive way to compile innovation KPIs into visually appealing visualizations. Tailored to specific objectives and goals, custom dashboards cut through the noise, allowing management teams to focus on critical insights that matter the most.
Custom innovation dashboard views provide targeted insights, enabling stakeholders and decision-makers to focus on critical aspects. By presenting clear insights into project performance and resource utilization, custom dashboards assist users in optimizing resource allocation. Teams can identify underutilized resources or potential bottlenecks, ensuring efficient time and budget allocation.
Promoting seamless cross-functional collaboration, an innovation dashboard provides a shared platform for viewing and discussing innovation progress. Stakeholders from diverse departments can access and interact with the same data, fostering a culture of collaboration and collective decision-making. Simplify report preparation with easy export and sharing functionalities, saving valuable time on manual processes.
Building custom charts and dashboards in ITONICS for better decision-making
In the ITONICS Innovation OS, two powerful features are available that enable data visualization and ensure informed decisions:
- The Chart Configuration lets you create new charts that can be placed inside the Dashboard pages afterward.
- The Dashboard View Configuration lets you add and organize charts to your custom dashboards.

Creating charts
Charts are visual representations of data. To create a new chart, navigate to Chart Configuration in the ITONICS system and select Add Chart to get started.
Choose an appropriate and concise name for your chart, e.g., "Trend Segmentation." Then, select which type of chart you would like to represent your data visually, e.g., "Pie Chart."
You can also choose to add more information about the chart, the color schema for the chart, and configure which types of data in the system the chart will represent.
Use the chart filter functions to narrow down the results you are interested in, e.g., "only show trends based on their segmentation which has a high market potential rating."
Once you've configured your chart, add it to your dashboard using the Dashboard View Configuration.
Creating dashboard pages and adding charts
To add your dashboards, navigate to Dashboard View Configuration. Via the button Add Tab, you can add your own dashboard page. A popup appears where you are asked to add a Title and configure which Users/Groups/Roles have access to this dashboard.
Once you’ve added your dashboard, you can place your charts in the dashboard. The interface will show you options on how you can place your charts. Some chart types can be placed next to each other, while others need a whole row.
After clicking Save, you can find your newly created dashboard in the main navigation.
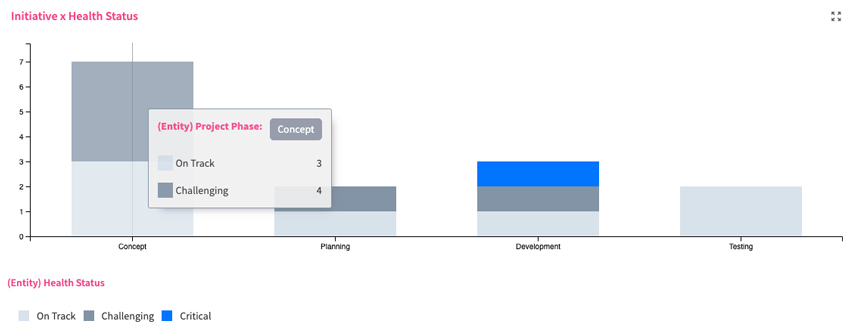
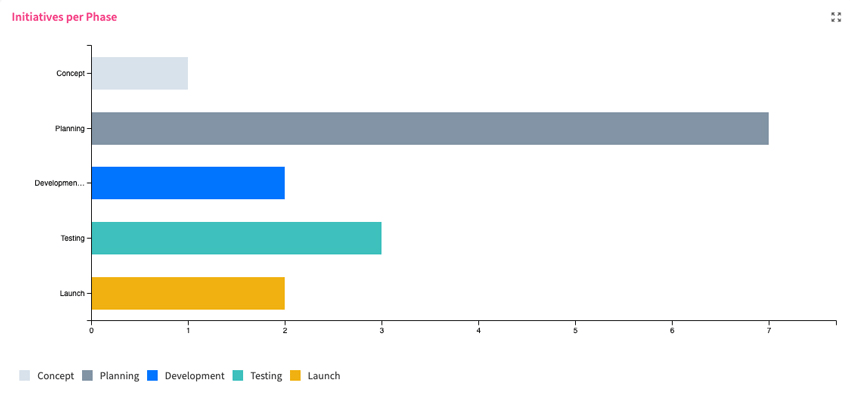
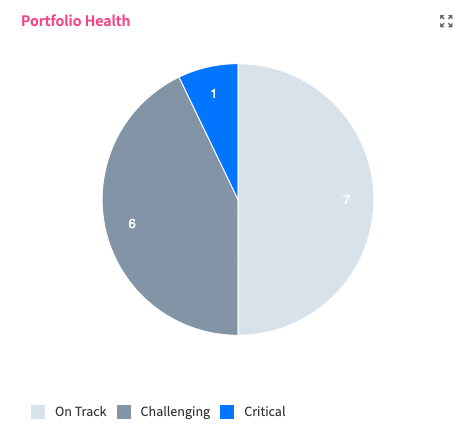
Types of reports you can create in ITONICS to share innovation insights and KPIs
- Idea pipeline: Showcase the flow of ideas through different stages of the innovation pipeline, from ideation to implementation. This provides an overview of the number of ideas at each stage and helps identify potential bottlenecks or areas for improvement.
- Resource allocation: Understand how resources, such as time, budget, and manpower, are allocated across various innovation projects. This allows for efficient resource management and optimization.
- Market trends and insights: Report on market trends, competitor analysis, and customer feedback, providing critical insights to inform innovation strategies and product development.
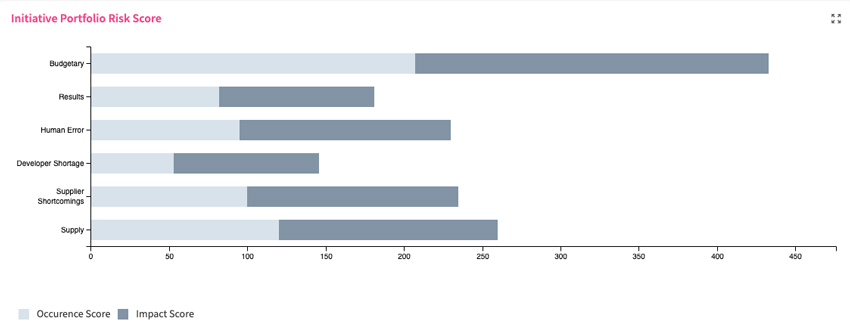
- Risk assessment: Display risk assessments for various innovation projects, helping stakeholders understand potential risks and make informed decisions.
- ROI and financial analysis: Visualize the return on investment (ROI) of innovation projects and provide financial analysis to assess the financial viability of initiatives.
- Collaboration and engagement: Reporting charts can highlight user engagement and collaboration within the innovation platform, indicating the level of involvement and commitment from stakeholders.
- Time-to-market: Charts can demonstrate the time it takes to bring an idea from concept to market, assisting in streamlining processes and improving time-to-market efficiency.
- Startup reporting: Showcase startup revenue growth over time, visualize market penetration and customer distribution across regions.
- Technology reporting: Visualize the allocation of resources to different technology projects, view risks associated with various technology initiatives, and adoption rates of different technologies across the organization or within specific projects.
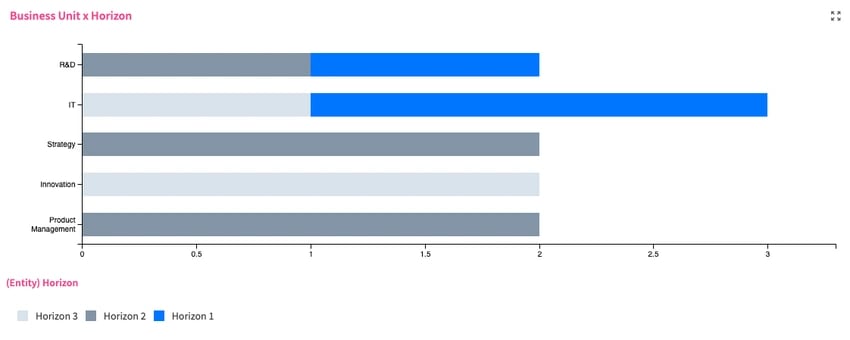
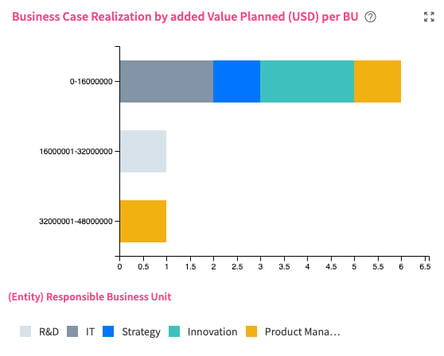
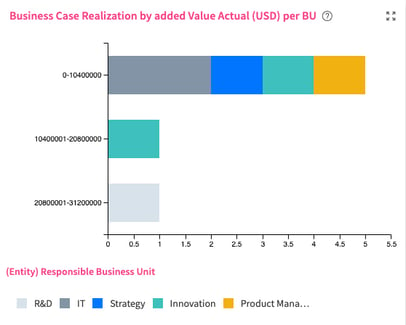
How to share relevant data with your management using custom dashboards
Top management teams are often inundated with vast amounts of information. Custom charts and dashboards allow you to focus their attention on the most critical points. Rather than sifting through numerous details, your custom dashboard will highlight key KPIs in one concise view.
- Export reports: Export charts and dashboards to share the visualizations with top management, as they can easily view and analyze the data offline.
- Dashboard sharing: Share dashboards directly with key stakeholders to enable management to view real-time data.
- Present your dashboards: Configure the views to showcase your insights and present them straight from the system.
Boost your innovation success with ITONICS
By presenting key performance indicators and critical insights in a visually appealing and easily understandable manner, custom dashboards empower organizations to cut through the noise and focus on the most essential information. Personalized views tailored to specific objectives help teams and decision-makers efficiently track progress, identify bottlenecks, and optimize resource allocation.
Moreover, the collaborative nature of custom dashboards fosters cross-functional teamwork and collective decision-making, enabling stakeholders to stay aligned and informed. As organizations continue to navigate the complexities of the innovation landscape, custom dashboards serve as a valuable asset in driving data-driven decisions, fostering a culture of innovation, achieving strategic goals, and ultimately increasing innovation success.
Connect reporting with project, idea, or startup Kanban Boards, growth initiative roadmaps, or drivers of change on one central platform. Enhance decision-making and streamline innovation management processes with the ITONICS Innovation OS.


