In the fast-paced realm of innovation, efficiently managing innovation project portfolios is crucial for sustained success. Nurturing high-potential initiatives and quickly identifying and rectifying low-performing projects is essential. Establishing a comprehensive set of Key Performance Indicators (KPIs) to evaluate project management office (PMO) performance and intricately aligning them with your innovation objectives is pivotal in navigating the complex landscape of project and portfolio management. These KPIs function as a compass, providing clear direction on which projects merit sustained attention and which demand a pivot, reassessment, or discontinuation.
PMO and PPM teams can track these indicators to evaluate project performance at various stages of the innovation lifecycle. The KPIs serve as dynamic yardsticks, allowing PMO and PPM leaders to adjust strategy execution, reallocate resources, or introduce course corrections based on real-time performance data.
A scoring model to help identify low-performing innovation projects
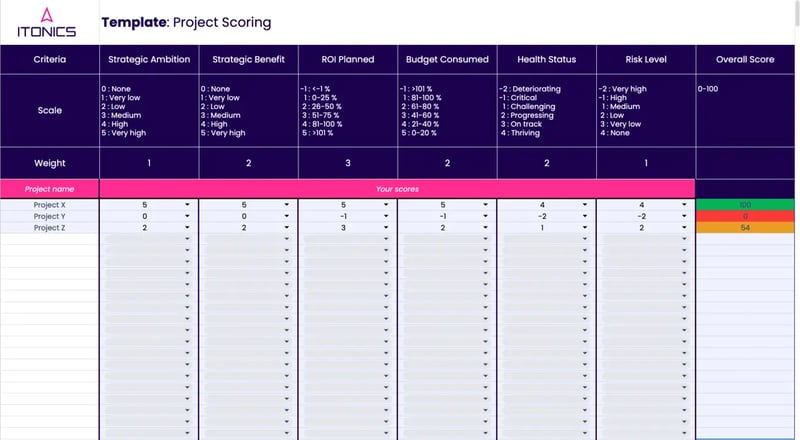
Utilizing a scoring model empowers PMO teams and PPMs, technology experts, and senior management to comprehensively evaluate projects, considering both qualitative and quantitative factors. This approach provides a detailed insight into the performance of each project or program, enabling the easy identification of areas for improvement. Teams can effectively benchmark performance and spotlight issues requiring attention. A meticulously designed scoring model serves as a perceptive tool, appraising projects against predefined criteria to generate a quantifiable score reflective of their performance. This holistic overview aids decision-makers in making informed choices, whether it involves reallocating resources, pivoting projects, or phasing out activities misaligned with overarching innovation objectives.
When creating a project scoring model, focus on essential criteria such as costs, team resources, strategic alignment, and risk level. Keep it straightforward by choosing no more than ten criteria for your model, using a scale of, for example, 0-5 to represent their importance. The aim is a balanced innovation portfolio with a clear focus on deliverables towards strategy execution. Some key categories to consider are:
Strategic Criteria: This includes intangible elements like strategic alignment and strategic benefit. These can be challenging to measure but are crucial, often measured alongside financial considerations. Use ITONICS Matrix to help determine strategic criteria based on collective evaluation and visualize outcomes.
Financial Criteria: Represented as a range of costs and financial benefits for each project, these scores provide an overview of budget needs. It's important, but it should be combined and compared with other factors to tell the complete project story.
Risk Factors: Assign risks as negative values, with high-risk factors subtracting from the total score.
Remember, weighing these criteria against each other is crucial for a comprehensive view of complex projects. Reach a consensus within your organization about the most critical factors to guide the selection and weighting process.
Centralize efforts to speed up and scale innovation
Centralizing efforts in innovation portfolio management significantly accelerates and scales the identification of low-performing projects. When information and processes are streamlined within a centralized system, gathering, analyzing, and comparing data across projects becomes easier.
Teams can quickly access key performance indicators (KPIs), metrics, and other relevant information, allowing for a holistic view of project performance. This centralized approach facilitates swift decision-making, as stakeholders can efficiently evaluate projects based on predefined criteria. Additionally, it promotes collaboration and communication, ensuring that insights are shared across the organization, leading to a more synchronized and effective response to low-performing projects. Centralization catalyzes efficiency, enabling organizations to identify and address underperforming projects with speed and precision.
See how to use ITONICS to identify low-performing innovation projects →
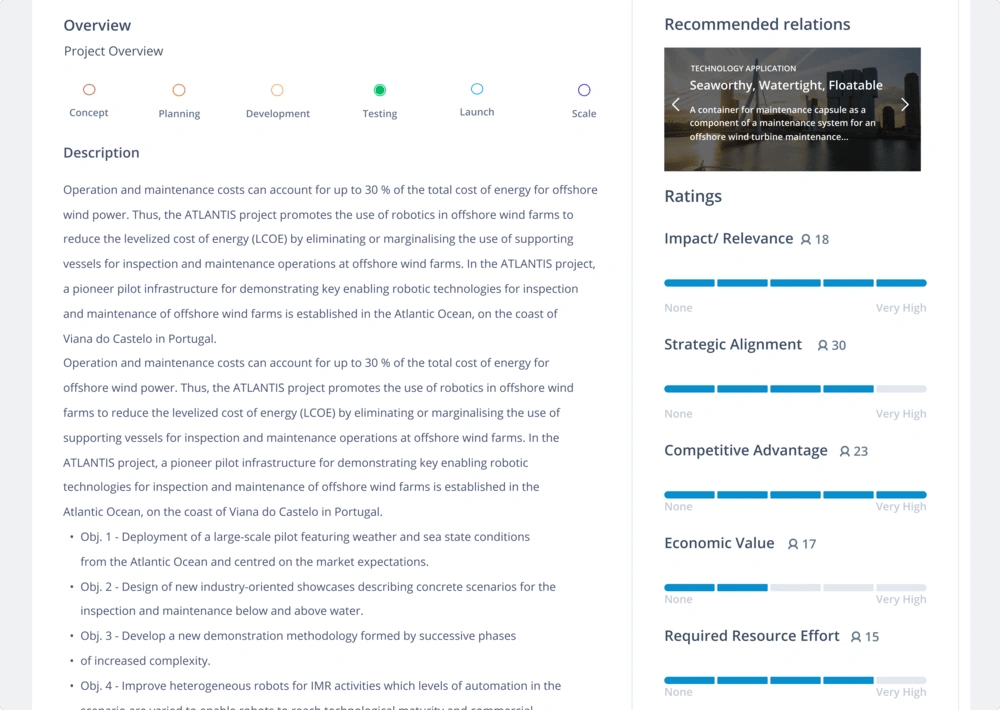
Leverage the power of collective intelligence with ITONICS ratings to swiftly identify low-performing initiatives. Whether you opt for best-practice criteria or tailor your own, the flexibility is yours. Utilize the Matrix tool to map initiatives, providing a visual guide to pinpoint focus areas based on your specific scoring criteria. This approach ensures a streamlined and efficient process for identifying and addressing underperforming initiatives within your innovation portfolio.

%20Portfolio%20Webinar%20-%20matrix%20with%20element.webp?width=1190&height=808&name=4)%20Portfolio%20Webinar%20-%20matrix%20with%20element.webp)
Streamline and systemize tasks to speed up identifying low-performing innovation projects
By using innovation portfolio management software, teams can streamline tasks, respond faster to market changes, and increase their capacity for other tasks. Digitizing the identification of low-performing projects offers real-time monitoring capabilities, allowing stakeholders to track project progress continuously. Any deviations from the plan or emerging issues can then be promptly identified. This ensures that problems are addressed early, preventing them from escalating and causing significant delays or resource wastage.
Teams and stakeholders can also track key performance indicators (KPIs) specific to their innovation goals with customizable Kanban Boards, Lists, and KPI reporting. The collaborative features of portfolio management software facilitate efficient decision-making, and teams can discuss project status, share insights, and collectively decide on the best course of action from one single point of truth.
By systemizing processes, teams can optimize resources and automate several tasks to analyze portfolios faster and make more confident decisions.
Use Conditional Formatting in ITONICS Lists to instantly identify when specific figures exceed or fall below a predefined threshold. For instance, in the Budget Left column, set up color configurations to prompt visual alerts when the threshold is exceeded. Any number below the designated threshold will be automatically highlighted in red, a clear indicator for projects approaching budget constraints. You can also use the KPI reporting widget to generate interactive visualizations to illustrate specific KPIs within the innovation portfolio. Various types of visualizations can be employed, including:
- Donut Chart: Suited for presenting categorical data such as Health Status, Phase, or Responsible Business Unit.
- Average Card: Provides a summary of the average value for specific criteria across all projects and/or programs in your list.
- Sum Card: Visualizes the total sum of all innovation projects and/or programs in your list.
- Min Card: Highlights the minimum value among all projects and/or programs in your list.
- Max Card: Highlights the maximum value among all projects and/or programs in your list.
Navigating your financial landscape with confidence
Centralizing and systemizing innovation project data within a dedicated digitized tool provides real-time insights and accelerates and scales the identification of underperforming projects. Integrate portfolio management activities with Foresight (Where to Play) and Ideation (How to Win) efforts on a single platform to ensure consolidated efforts, time-saving, improved collaboration, and enabling the scalability of innovation across the entire organization. This integrated approach allows organizations to navigate the innovation journey efficiently, ensuring projects align with overarching objectives and respond dynamically to emerging challenges.


